


FICH Public Equities is a systematic, long-only investment strategy that trades exclusively within the S&P 500 universe. The algorithm evaluates relative strength every month and automatically rotates capital into the most dominant stocks, maximizing exposure to leading macro trends while completely removing human bias.
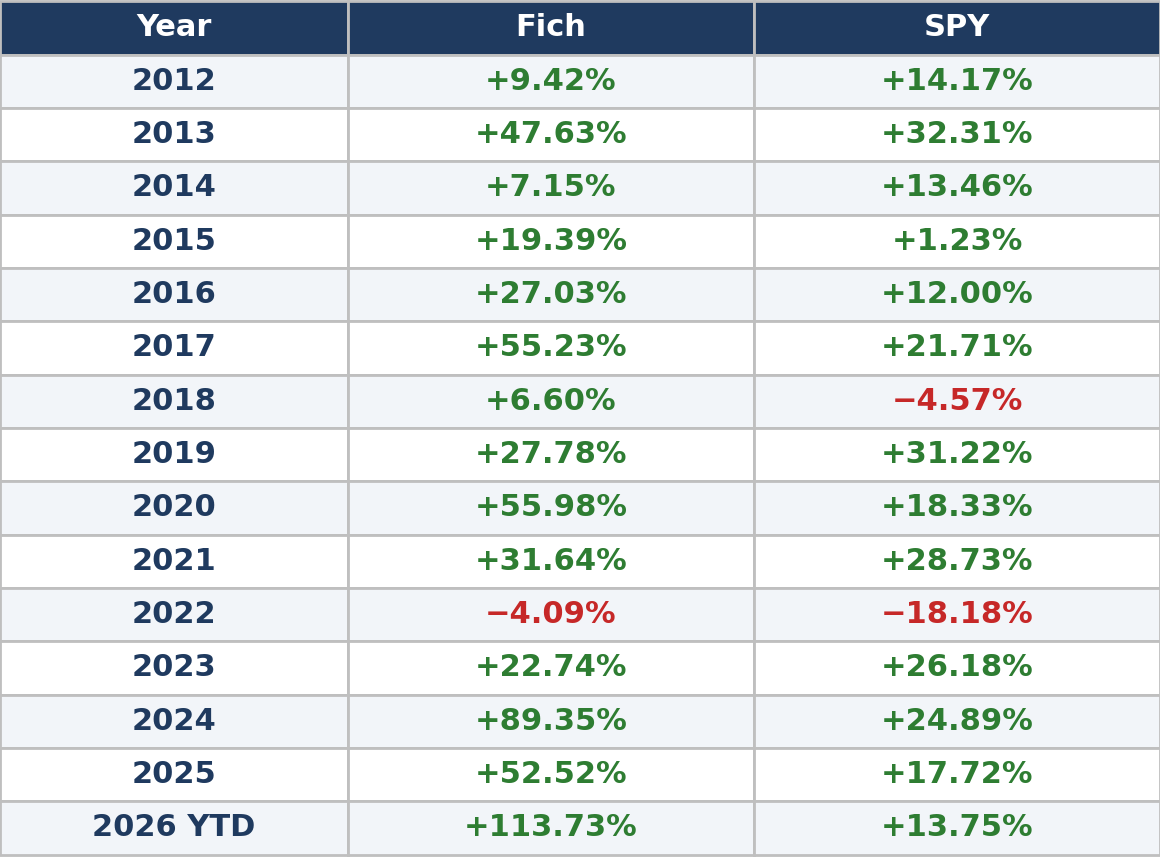
Annual Returns — Fich Strategy vs SPY
1. Macro Overview
U.S. equity markets stayed relatively resilient over the past 30 days despite rising long-term Treasury yields, with the 10-year near or above 5.3%, pressured by higher energy prices and persistent inflation concerns tied to geopolitical tensions and oil supply.
Index performance was mixed: the S&P 500 slipped about 0.4–0.5%, the Dow Jones fell roughly 4.3%, and the Nasdaq gained around 1.9%.
Market leadership remained concentrated in technology and AI-related stocks, supported by optimism around earnings, semiconductors, and infrastructure spending, while defensive and rate-sensitive areas were pressured by higher yields and oil volatility.
Market breadth stayed narrow, with most individual stocks and non-tech sectors lagging.
Momentum-driven flows favored Technology most strongly, with selective rotation into Health Care and parts of Communication Services.
Significant outflows and relative weakness were seen in Industrials (including very large weekly selling), Financials, Real Estate, Utilities, Consumer Discretionary, Materials, and Consumer Staples as rising yields and energy costs weighed on performance.
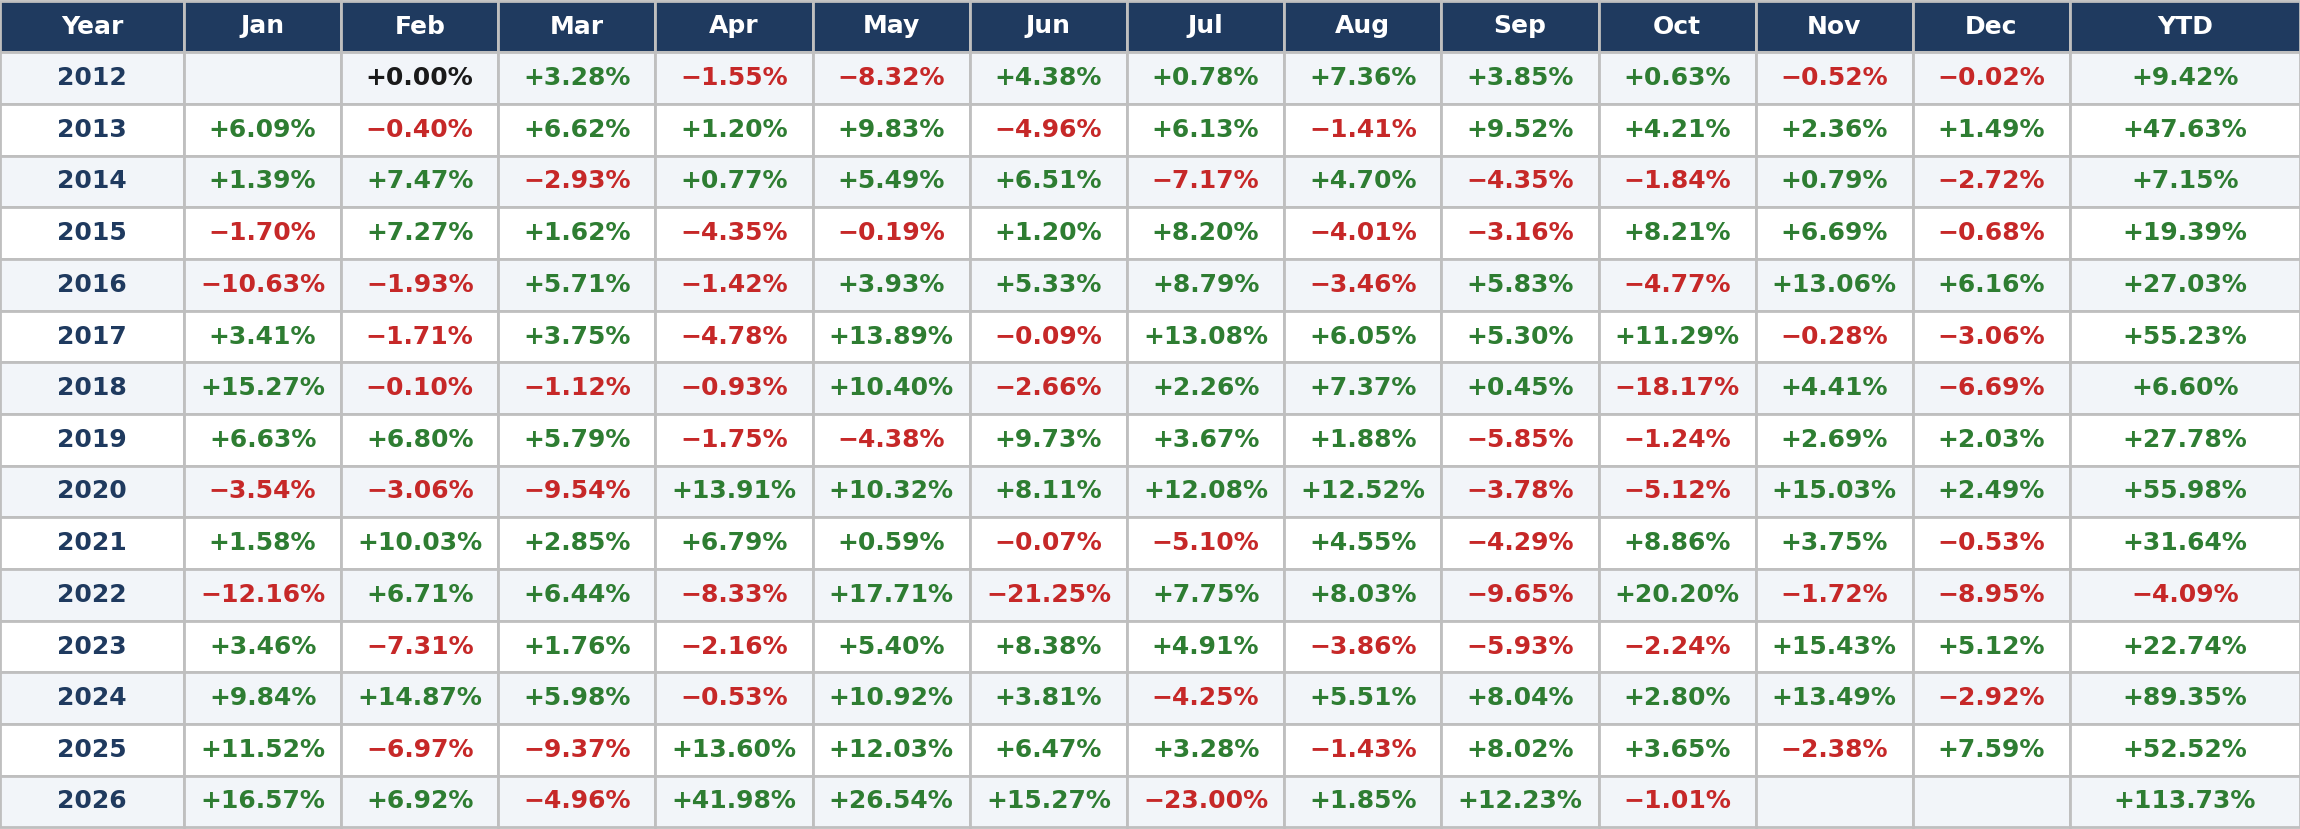
Fich Monthly Returns (2012 – present)
2. Last month overview: Fich Equities vs the market
In September 2026, Fich Equities strategy returned +12.23% in September, against −0.33% for the S&P 500.
Stepping back to the year-to-date picture:

3. The portfolio at this rebalancing: bought, sold, and held
On October 2, 2026, the system closed 2 positions, opened 2 new positions and held 9 from the previous months, leaving the portfolio at roughly 0.55% cash.
The algorithm systematically closes underperforming stocks while holding positions with strong momentum.
Closed trades, return on each closed position:

New Trades:

Current portfolio:
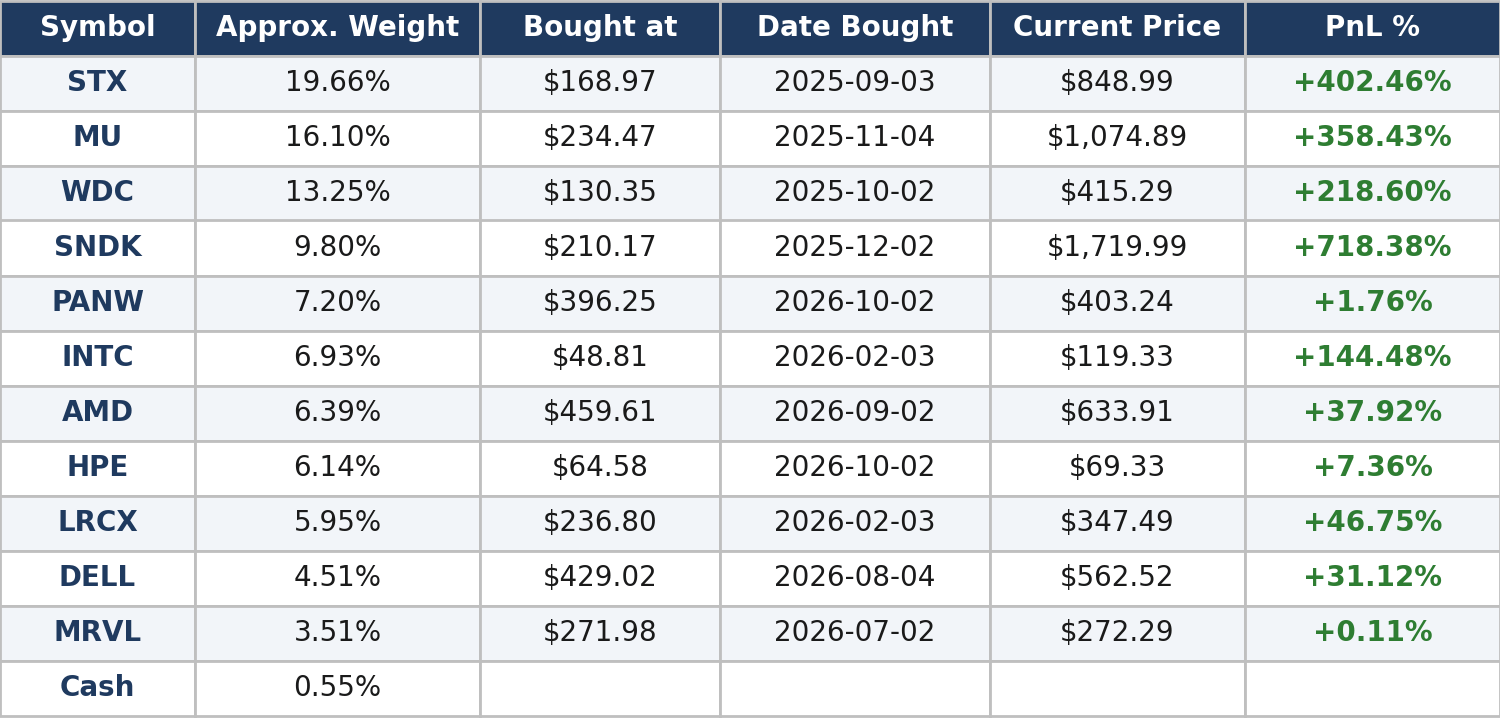
Portfolio update
STX (Seagate Technology) - Weight 19.66%
Seagate delivered record fiscal 2026 results, with Q4 revenue of $3.63 billion (up 48% year-over-year) and non-GAAP EPS of $5.71, both exceeding guidance, driven by robust AI and cloud data center demand for high-capacity HDDs. Full-year revenue reached $12.2 billion (up 34%), with non-GAAP gross margins expanding to 46.1% and free cash flow of $3.1 billion. Q1 FY27 guidance calls for $4.1 billion in revenue and non-GAAP EPS of $7.30. Shares recently declined over 10% following reports of Toshiba expanding HDD production for AI applications, though analysts maintain a Strong Buy consensus with a $1,125 average price target. Next earnings are scheduled for October 27.
MU (Micron Technology) - Weight 16.10%
Micron reported record fiscal Q4 2026 results, with revenue of $54.23 billion (up 379% year-over-year) and non-GAAP EPS of $33.42, beating estimates amid surging AI memory demand, particularly HBM and DRAM (73% of sales). Full-year revenue hit $133.19 billion (up 256%), with gross margins expanding significantly. Q1 FY27 guidance of $61.5 billion revenue and $38.15 non-GAAP EPS exceeds consensus, supported by $32 billion in long-term supply agreements and increased capex. The company highlighted a strong HBM roadmap, including custom implementations with Nvidia.
WDC (Western Digital) - Weight 13.25%
Western Digital posted solid fiscal Q4 2026 results, with revenue of $3.75 billion (up 44% year-over-year) and adjusted EPS of $3.56, beating estimates on strong HDD demand from AI storage. Full-year revenue was $12.9 billion (up 36%). Q1 FY27 guidance is $4.1 billion revenue and $4.00 adjusted EPS. Shares fell recently alongside peers due to Toshiba’s HDD expansion plans, but the company benefits from tight supply and its flash spin-off. Next earnings are October 29. Analysts see continued strength in the storage supercycle.
SNDK (Sandisk) - Weight 9.80%
Sandisk (spun off from Western Digital) reported fiscal Q4 2026 revenue of $8.97 billion (up 51% sequentially, 372% year-over-year) and non-GAAP EPS of $39.25, driven by NAND pricing and data center growth (up 437% for the year). Full-year revenue reached $20.25 billion (up 175%). The company has $93.9 billion in long-term supply agreements covering a growing share of bits. Q1 FY27 guidance is $10.3–$10.8 billion revenue. Next earnings October 29; shares have been volatile but supported by AI NAND demand.
PANW (Palo Alto Networks) - Weight 7.20%
Palo Alto Networks reported fiscal Q4 2026 revenue of $3.41 billion (up 34% year-over-year) and non-GAAP EPS of $1.02, beating estimates, with Next-Generation Security ARR at $9.10 billion (up 63%) and RPO of $21.2 billion (up 34%). Platformization and AI security drove record net new ARR of ~$970 million. Q1 FY27 guidance includes 33–34% revenue growth and NGS ARR of $9.54–$9.56 billion. Full-year FY27 revenue outlook is $14.10–$14.20 billion (23–24% growth). Acquisitions like CyberArk are integrating well.
INTC (Intel) - Weight 6.93%
Intel’s fiscal Q2 2026 results showed revenue of $16.13 billion (up 25% year-over-year) and non-GAAP EPS of $0.42, beating estimates, with Data Center and AI segment up 59%. Gross margins improved to over 41% non-GAAP. Q3 guidance is $15.8–$16.8 billion revenue and $0.38 non-GAAP EPS. The company is ramping foundry and 18A process amid strong server CPU demand outpacing supply. Next earnings October 22. Capital spending is elevated to support recovery.
AMD (Advanced Micro Devices) - Weight 6.39%
AMD reported fiscal Q2 2026 revenue of $11.54 billion (up 50% year-over-year) and non-GAAP EPS of $1.66, beating estimates, with Data Center revenue doubling to $6.7 billion on EPYC and Instinct demand. Q3 guidance is ~$13 billion revenue. The company announced acquisitions (World Labs, Taalas) and major partnerships (Anthropic, Microsoft, OpenAI) for AI GPUs. Data Center is expected to more than double in 2027. Next earnings November 2.
HPE (Hewlett Packard Enterprise) - Weight 6.14%
HPE delivered record fiscal Q3 2026 results, with revenue of $12.2 billion (up 34% year-over-year) and non-GAAP EPS of $1.11, beating estimates, driven by servers, AI systems, and networking (up 75%). Non-GAAP gross margin hit 40.4%; AI backlog reached $7.6 billion. Q4 guidance is $13.9–$14.8 billion revenue. FY26 outlook raised to 34–37% revenue growth and $3.75–$3.85 non-GAAP EPS; FY27 growth 13–17%. H3C divestiture provided proceeds.
LRCX (Lam Research) - Weight 5.95%
Lam Research reported fiscal Q4 2026 revenue of $6.72 billion (up 30% year-over-year) and non-GAAP EPS of $1.82, beating estimates, with full-year revenue of $23.2 billion (up 26%). Q1 FY27 guidance is $8.1 billion revenue (±$400 million) and EPS of $2.15 (±$0.15). WFE spending outlook raised to low-$150 billion for calendar 2026. Dividend increased 27%. Next earnings October 21. Strong AI-driven wafer fab equipment demand.
DELL (Dell Technologies) - Weight 4.51%
Dell reported fiscal Q2 2027 record revenue of $46.97 billion (up 58% year-over-year) and non-GAAP EPS of $7.04, beating estimates, with AI-optimized servers at $16.4 billion (doubled) and $60.9 billion in AI orders, pushing backlog to $95 billion. ISG revenue up 89%. FY27 guidance raised to $192 billion revenue and $25.50 non-GAAP EPS. Q3 guidance $49 billion revenue. Traditional servers also accelerating.
MRVL (Marvell Technology) - Weight 3.51%
Marvell reported fiscal Q2 2027 revenue of $2.74 billion (up 37% year-over-year) and non-GAAP EPS of $0.94, beating estimates, with data center at 79% of sales (up 46%). Q3 guidance $3.15 billion revenue (±5%). FY27–FY28 outlook raised, targeting ~$18 billion in FY28, driven by AI interconnect, custom silicon (including Google TPU), and optical. Non-GAAP gross margin ~59%. Dividend declared; next earnings December 1.
4. Multi-year track record
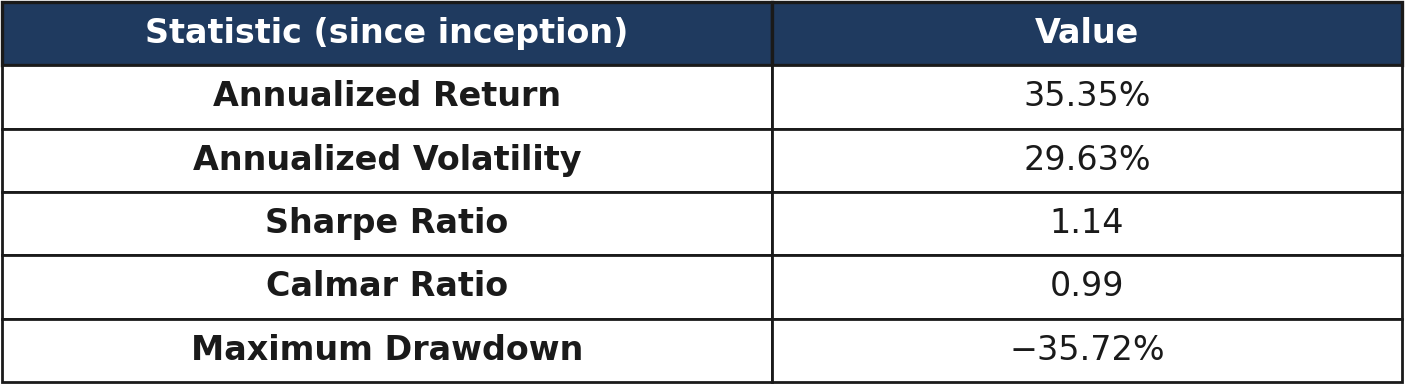
As of yesterday, that hypothetical $1,000 was worth $82,819.06 in the strategy, versus $7,794.43 in S&P 500.
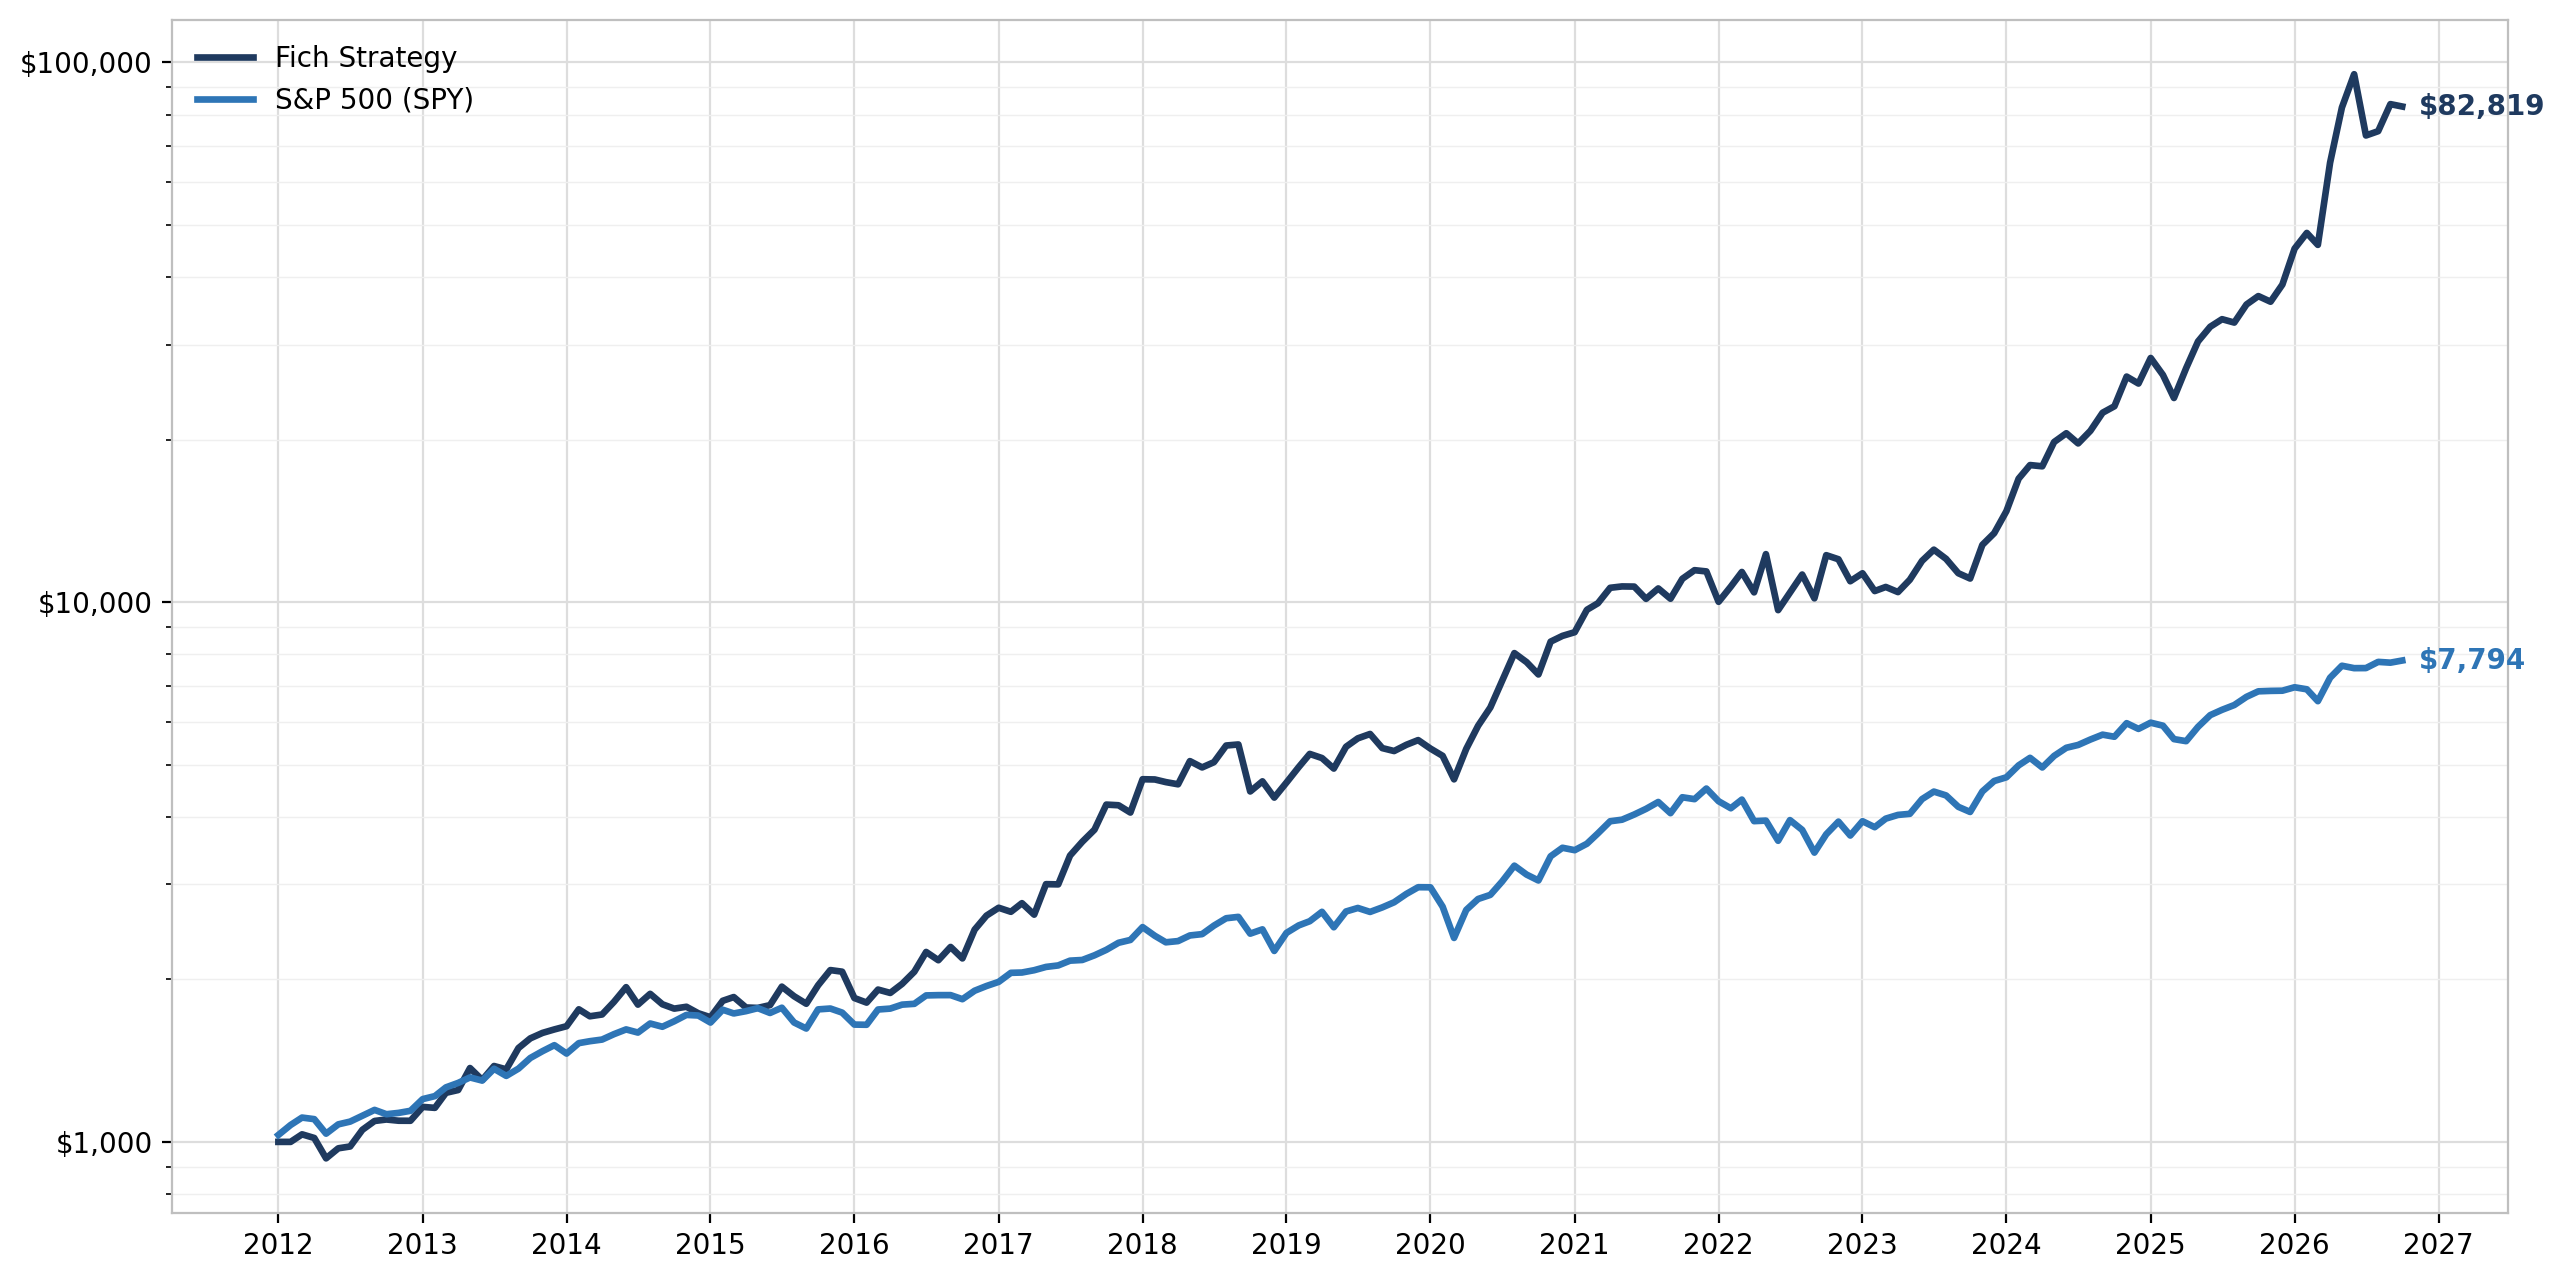
Fich Equities Strategy vs. SPY - growth of $1,000 since inception (log scale).
Disclaimer: Past performance is not indicative of future results. All strategy performance metrics and stated returns are net of a 0.10% commission fee per trade. This letter is for informational purposes only and does not constitute investment advice. For comprehensive historical data and complete execution logs, visit fich.ai.